Case Study 01: CRANK LENGTH VS POWER and CADENCE
Author: Matt Appleman
Publish Date: 12/30/2022
How does crank length affect power and cadence?
In this case study, we’ll look at the results from test subject and owner of Appleman Bicycles, Matt Appleman.
Crank length and how it affects bike fit is shrouded in mystery… or at least a bit misunderstood. Let’s see what insight we can find about crank length, power and cadence.
Table Of Contents
TL:DR – Summary
135mm, 155mm, and 175mm crank lengths were ridden during ramped power tests. Power and cadence were analyzed.
Crank Length tested had a 26% range.
Average 1-Minute Power showed a 2.6% range and is not correlated to crank length.
Average Cadence had a 14% range and correlation is not clear.
The Test
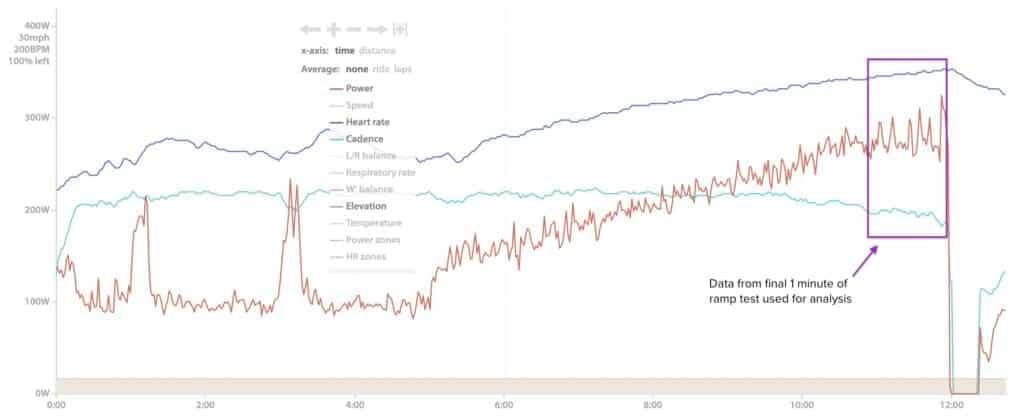
A “ramp” test was used on an indoor smart trainer. The last 1-minute of the ramp (the hardest part of the test) was analyzed and averaged using a cycling analytics software.
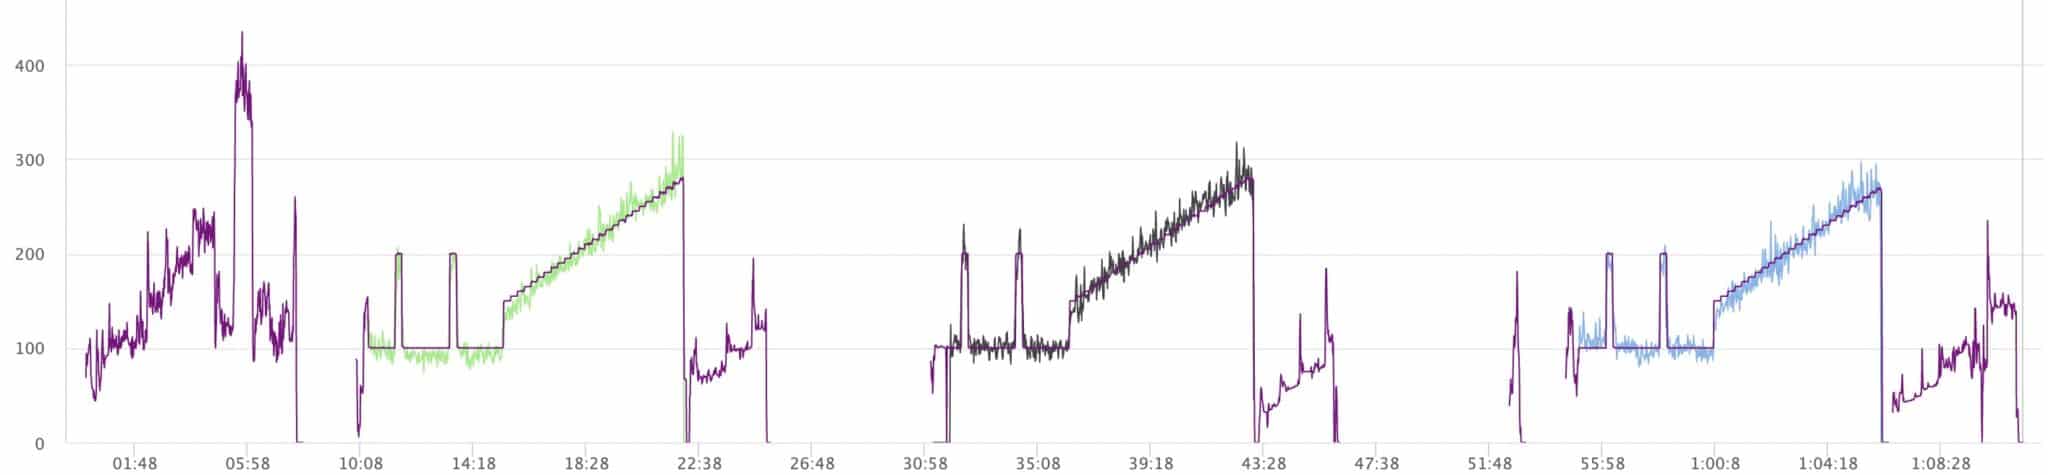
Each crank length was tested 6 times total. Each session tested each of the crank lengths 1 time.
To minimize any effect of fatigue throughout a session or challenges switching from short to long cranks, the crank lengths were tested in a different order each session. Each length was tested 1st two times, 2nd two times and 3rd two times throughout the 6 sessions.
- A smart trainer in “erg mode” was used to control resistance.
- Power meter pedals (with a claimed +-1% accuracy) and a compatible cycling computer were used to record the test data.
- The same gear (42x21t) was used throughout the testing, no shifting.
- A seated position with hands on the hoods was maintained throughout the ramp test.
- Cadence was riders choice, but was not visible during the test.
- Saddle height was the only bike fit adjustment made when switching crank lengths.
- The rider could not see any indication of time, power, cadence or any other data.
The test subject, me, has historically ridden 145mm and 155mm cranks for 5 years and is well accustomed to them. This sort of test, a short but intense effort, is common in my day to day training. Some pertinent stats about me:
- Height: 6’2″ (1.88m)
- Inseam: 34.5″ (876mm)
- Tibia length: 15.5″ (394mm)
The Method
Warm up: A 7-10 minute warm up was used to prep the body and equipment. After the warm up period, a spindown calibration was performed on the trainer and the power pedals were also calibrated at this time.
1: Ride Easy 5 minutes @ 100w with 2, 15 second 200w sections was used to acclimate to the new crank length and recover.
2: The Ramp: A constant increase in resistance was programmed into the trainer. Starting at 150w, resistance increased at a rate of 20w/minute until required power couldn’t be maintained.
3: Recovery: 3 minutes of recovery riding at the riders choice effort.
4: Swap Crank Length: Switching crank length, reinstalling pedals, adjusting seat height, inputting new crank length into cycling computer and power pedal calibration took approximately 5 minutes.
Steps 1-4 were repeated 3 times each session.
The Results
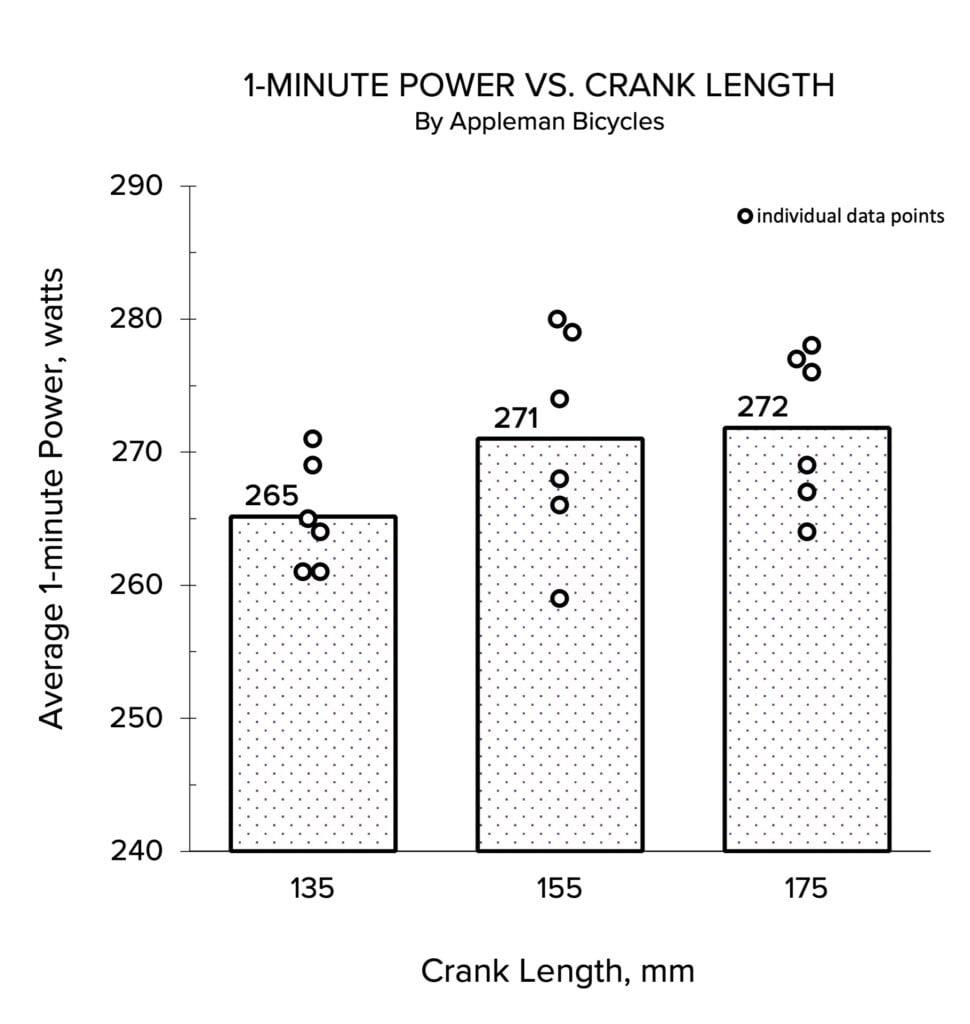
Analysis: Average 1-minute power VS. Crank Length
At first glance, we see that the 175mm and 155mm cranks had nearly identical average power with only a 1 watt difference. The 135mm crank power averaged 7 watts (or 2.6%) less than the 175mm. Let’s keep looking.
Let’s look at the how spread out the data points are. Interestingly, the 155mm cranks had both the highest and lowest recorded power of the whole test (largest range). This may show the natural variation of the rider from day to day and/or the test setup itself.
We must also examine the overlap of the dataset. 50% of data points lie between the lowest 175mm value and highest 135mm value. Given the spread of the dataset and relatively small difference between average power for each crank length, it is reasonable to conclude that there is not a clear and obvious correlation between average 1-minute power and crank length.
With a 26% range in crank length and only 2.6% in average 1-minute power, it’s safe to say that crank length (leverage) is not a driving factor in power production.
Result: No (or very weak) Correlation
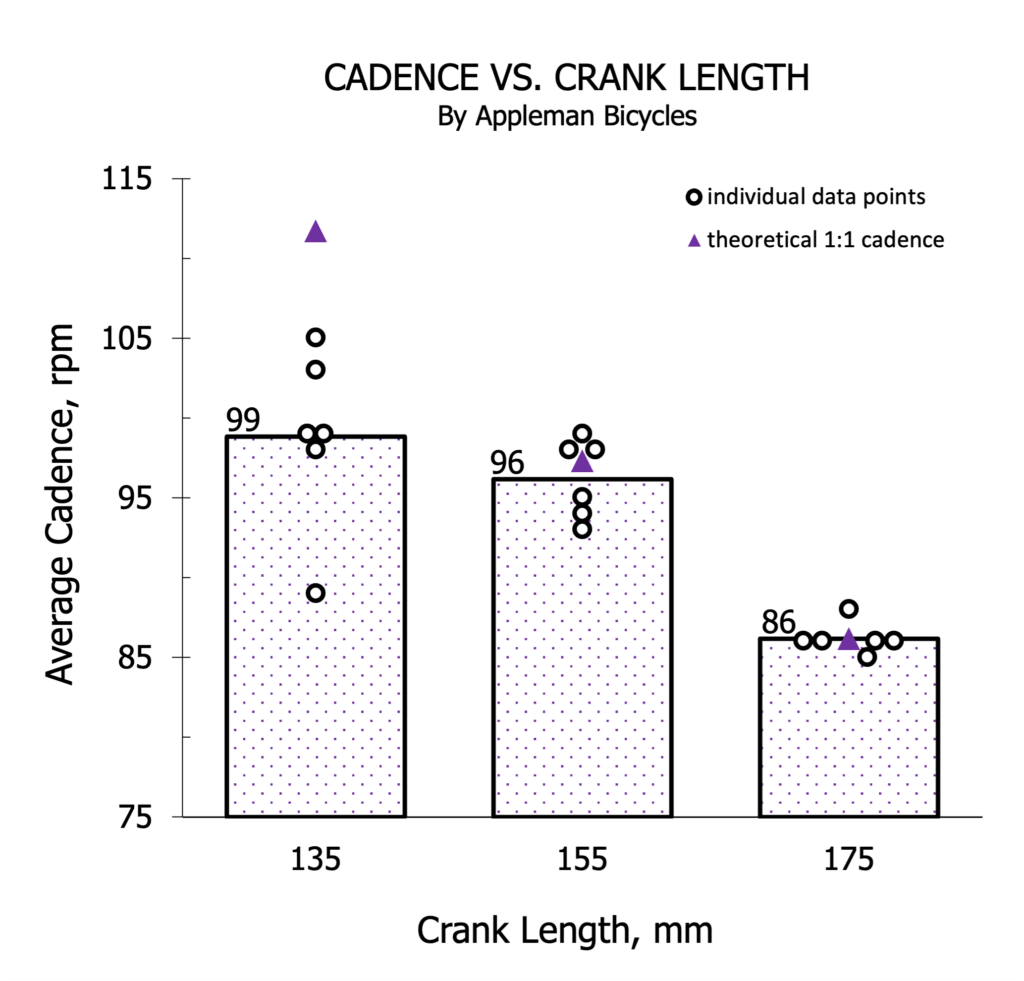
Analysis: Average Cadence VS. Crank Length
It is commonly theorized that cadence correlates directly with crank length. Theoretically, shorter cranks spin faster to than long cranks to make up for a shorter lever. The physics of Force X Distance and Tangential Velocity (speed of the pedal at a given cadence and crank length) also supports the theory of a 1:1 cadence/crank length correlation.
Does this 1:1 relationship hold water in this testing? It’s complicated. Yes, when we look at the 155mm and 175mm cranks. No, when we look at the 135mm and 155mm crank lengths.
Comparing the 155mm and 175mm cranks, we see a near 1:1 correlation between cadence and crank length. The theoretical cadence is only 1rpm higher than the measured cadence. Physics for the win!
If the 175mm cadence of 86rpm is used as a base, then we could extrapolate the cadence data as follows:
-175mm = 86rpm (base)
-155mm = 97rpm theoretical 1:1 ratio
-135mm = 112rpm theoretical 1:1 ratio
Looking at the 135mm and 155mm crank lengths we see a large gap between the theoretical 1:1 ratio and the actual results, a 13rpm difference. However, actual average cadence values are within 3% of one another and average 1-minute power values are within 2.2% of one another. Perhaps the 1:1 correlation isn’t necessary and similar power can be developed at similar cadences despite changes in crank length? Depends how you look at it.
Why the 13rpm difference on the 135mm? One possibility is that I (the test subject) am not well trained at producing high power above 100rpm, it’s certainly not common in my training regime. Further research is needed to determine the root cause of this difference.
Result: Correlation is not clear (depends how you look at it)
Conclusion: Limitations : Improvements
I didn’t know quite what to expect when it came time to analyze these results. There’s a really big spread between 135mm and 175mm cranks (26%) so it provided lots of opportunity to discover the significance of how power and crank length correlate.
The take-home message here is that crank length has no (or very little) impact on 1-minute power output. The body seems to be the source of power production regardless of crank length or leverage.
175mm and 155mm cranks showed no difference in power and average cadence correlated to the theoretical values.
The 135mm cranks showed a 2.6% lower average power and didn’t match up with the theoretical cadence. When we looked at the overlap and range of all of the data, it’s difficult to conclude that 1-minute average power of any of the crank lengths tested were significantly different from one another.
Improvements
No test is perfect and cycling certainly has it’s challenges with many variables in body and bike. I believe this test and procedure to be robust and produce meaningful results.
Fit: The test could’ve done more to maintain rider position between crank lengths, but for the effort involved in doing so, much tail chasing would ensue as changing one variable on the bike changes many others. By only adjusting seat height, it keeps it simple. If anything this adjustment give favor to longer length cranks by having a more upright torso position.
The Ramp: The ramp test is interesting because fatigue slowly overcomes the rider at a relatively low wattage. It’s not a flash in the pan like a maximal sprint power test. Different types of tests could be substituted to target different aspects of cycling (sprint, time trial, endurance). This ramp test is short, simple and can be performed multiple times/session without causing excess fatigue time over time.
Sample Size: A sample size of 1 is something, but obviously more riders tested would be better.
Rider Size: It would be of special interest to test how rider size, inseam, and tibia length interact with crank length, power and cadence.
I hypothesize that there is little downside to riding shorter cranks than you currently have. Are there cranks that are too short? Not in the lengths tested here. Can cranks be too long for someone? Probably. I’d love to see what the testing says.